Deciding whether the benefits a project could potentially deliver is good enough for it to start or not, is always a challenge.
This becomes even more difficult when you have a portfolio of projects vying for the same resources and money. Making the wrong decision can seriously impact your organisational performance and the successful delivery of your business strategy.
So how can you visualise the benefits across your business portfolio to help you make the correct investment decisions and track your projects, to ensure benefits are delivered as planned?
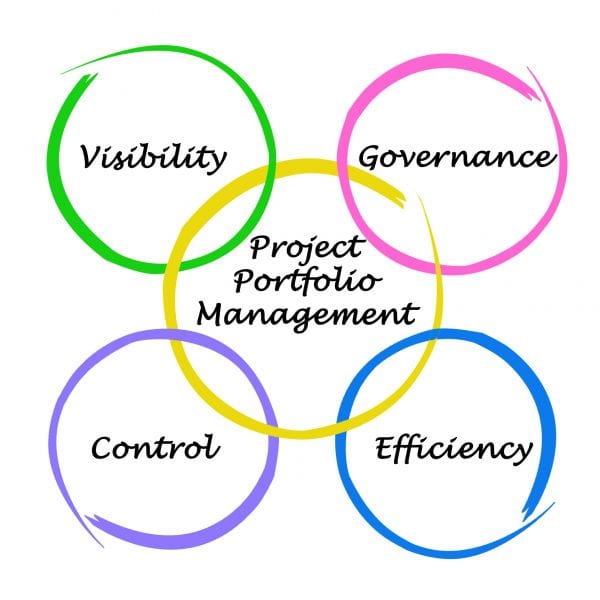
Strategic Project Portfolio Management (PPM)
A key component of your business strategy and governance is your project portfolio management. Typically people think of PPM as a management system to help manage active projects across your business. PPM is critical to managing and supporting your strategic investment decision making, before they become projects. PPM also helps you to track and manage the successful delivery of your strategic targets and benefits.
Making a wrong investment decision and allowing a project to use valuable resources and funds will have adverse impacts on your organisational performance and the successful delivery of your business strategy targets (objectives, outcomes and benefits). According to research outlined in a Harvard Business Review:
- 85 percent of executive leader ship teams spend less than one hour per month discussing strategy
- 50 percent spend no time at all
- An average 95 percent of employees don’t understand its strategy
- 90% of businesses fail to meet their strategic targets
Managing this process is not easy especially when you have a variety of investments and active projects from different functions such as HR, IT , R&D, Manufacturing, Quality, Engineering, etc. all delivering a range of benefits and degrees of business risk.
One of the main aims is to ensure you do not waste any funds and resources that do not contribute value to your business. Furthermore, you do not want to be risk adverse and under invest to potentially weaken you in terms of performance and competitiveness in the marketplace.
Being able to align and measure your investments and active projects against your strategic targets, objectives and outcomes is crucial and must be done in a way that is comparable across your portfolio.
Prioritising Your Investment and Project Portfolio
Typically your investments for projects and initiatives will be made at your main board, or a specific investment or project board to review and evaluate both investment proposals and active projects against the agreed business case and your business strategy. This needs accurate and reliable data and information for each investment and project, so that an informed decision and prioritisation can be made collectively.
This can be challenging. Just getting this data and information in a format that can be compared and analysed, especially when there are a wide range of projects and investments with varying degrees of benefits and risks. Members of the investment board will probably be in a different locations, time zones or working remotely (hybrid working), so having the ability to share, view and analyse your portfolio in one place becomes really important. Having multiple investment papers, spreadsheets and presentations sent by email does not support a very collaborative analysis and prioritising process.
You also have to get updates from your active projects so that you can compare and redirect or add resources or funds due to business changes and or prioritisation.
How do you do this now?
If you are like a lot of other businesses this is a combination of scheduled meetings supported by documents, spreadsheets, presentations including data and information from other Line of Business Systems such as your financial, ERP, Product Development Lifecycle, CRM, Contract Management, etc.
Having scheduled meetings is fine but not very agile or responsive. What happens in between these meetings? As to getting the data and information, this is more often than not, a manual, time consuming process, involving a lot of non-added value activities such as copying and pasting, emailing and updating. Not very beneficial!
This becomes even more difficult when you have other investments that are smaller and are part of a larger programme and are managed locally or by other project steering boards, functions and teams.
What is required is a quick and easy way to get a portfolio view of your investments and projects that shows how well you are delivering the benefits against your strategic business priorities, objectives and outcomes.
Benefits Management
Every investment, initiative and project needs to deliver the right benefits for your business, which is why they need to be linked and aligned to your business strategy.
According to Ward and Daniel authors of “Business Management: How to Increase the Value of your IT Projects”, when considering and reviewing these investments and current projects at a business level you need to consider the:
- Importance to current business
- Importance to future business
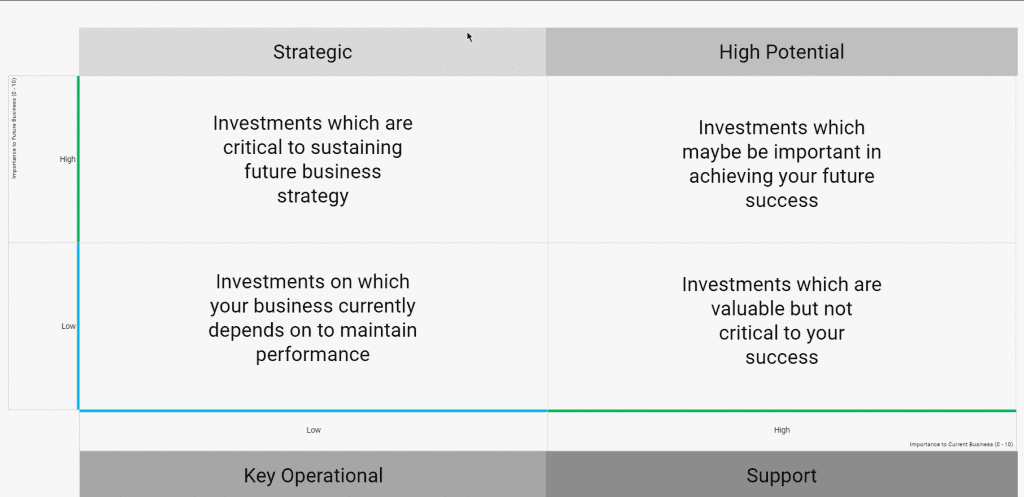
Visualising these investments in a 2 x 2 matrix can help you identify where they sit in the following 4 categories:
- Strategic – investments which are critical to sustaining future business strategy
- High Potential – investments which maybe be important in achieving your future success
- Key Operational – investments on which your business currently depends on to maintain performance
- Support – investments which are valuable but not critical to your success
Reference: “Benefits Management: How to Increase Business Value of Your IT Projects” by John Ward and Elizabeth Daniel.
Benefits Management Process
Not completing the above assessment can lead to poor benefits management resulting in low or total lack of alignment to your business strategic drivers, objectives and outcomes. Adopting a PPM and Governance approach reduces the risk of this misalignment. The following benefits management process includes these 5 steps that can be applied across your business.
- Identify and structure benefits
- Plan benefits realisation
- Complete benefits plan
- Review and assess results
- Identify potential for additional benefits
As you go through this process you need to answer the following questions in terms of:
- Why do you want to make this improvement investment?
- What do you think the improvements will or could be?
- What do you think the benefits are and where do you think they will happen?
- Who is responsible for delivering these benefits – RACI matrix
- What changes are needed to realise these benefits (enabling and business changes)
- Who are the stakeholders who will be affected by these changes and benefits, both positively or negatively? (Stakeholder Management)
- How and when can you make these changes to deliver these benefits successfully? (PPM Timeline)
Integrating and aligning your business strategy to your benefits
Now that you have created your investment business cases including the benefits, risks, resources and costs to implement, you need to align them to your strategic business drivers, objectives and outcomes. This will enable you to compare your proposed benefits against one another and your current projects to determine if you are going to approve and or reallocate resources and funds.
To able to see, evaluate and decide you can use a Benefit Dependency Network.
Benefit Dependency Network (BDN)
Benefits are delivered as the result of successful changes. You can categorise these changes by:
- Doing new things
- Doing things better
- Stop doing things
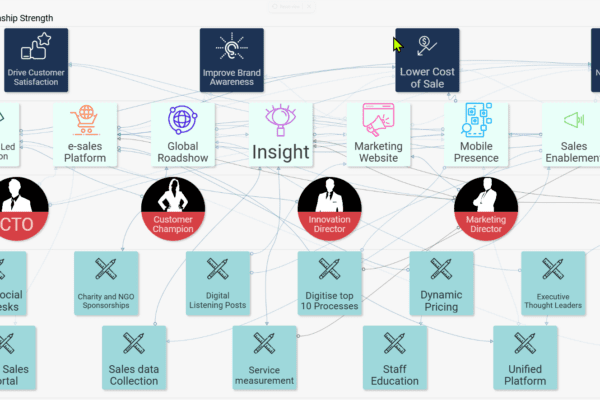
The BDN is based on a project management technique called Precedence Diagramming Method and is developed/read right-to-left. The BDN is a great collaboration and communication tool because you can see everything on one page.
You start with your investment objectives on the right hand side and are used to identify the benefits. To deliver these benefits you identify the necessary business and enabling changes you need to make to deliver the benefits. The business changes are permanent such as new or different ways-of-working. Enabling changes are one off changes that facilitate and help deliver the business change such as training, defining roles and responsibilities or collating data. These changes will then deliver the benefits.
Once you have done this you can determine what you need in terms of investments and projects (functionality, performance, capability) to support the changes and deliver the benefits.
In terms of completing the changes you may find out that you do not need to invest in new equipment or IT because you are able to deliver the benefits with your current assets and making the necessary changes.
Where these changes cannot deliver the benefit by themselves, the identification of a new IT system for example can be added and linked to the enabling and or business change. Your BDN can get quite complicated and so it is sometime useful to split then out in to Benefit Types.
By joining up this network you start to see the dependencies between the changes and the benefits. You will be able to see that a benefit can only be delivered when the changes are completed.
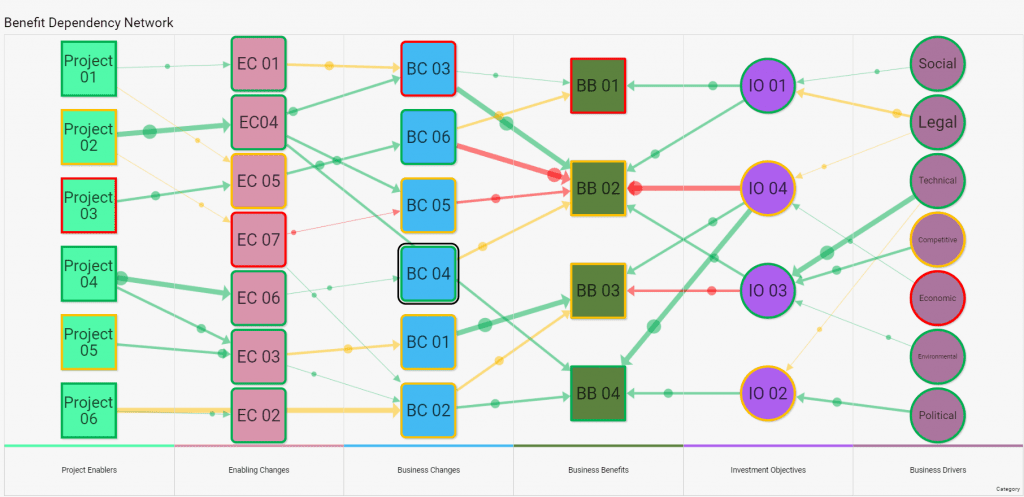
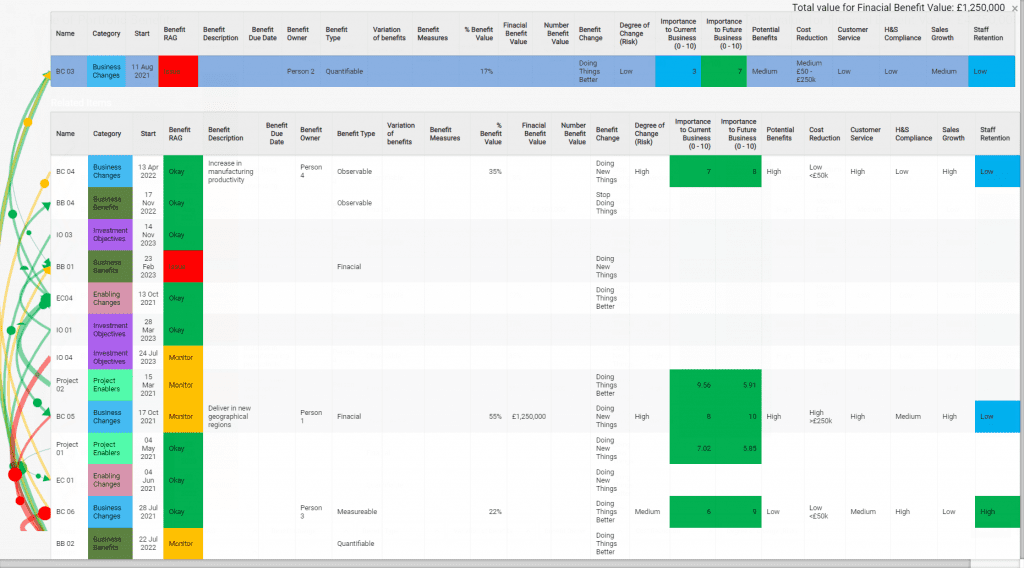
Portfolio Benefit Data and Information
Above is an example of Roelto Benefits Dependency Network solution (R-BDN), powered by SharpCloud. This visual, interactive and collaborative BND enables you to review your portfolio of investments and projects all in one place.
The data driven view above shows you the RAG status both of the BDN items and their dependency. The thickness of the dependency shows the priority (thin = low priority and thick = high priority).
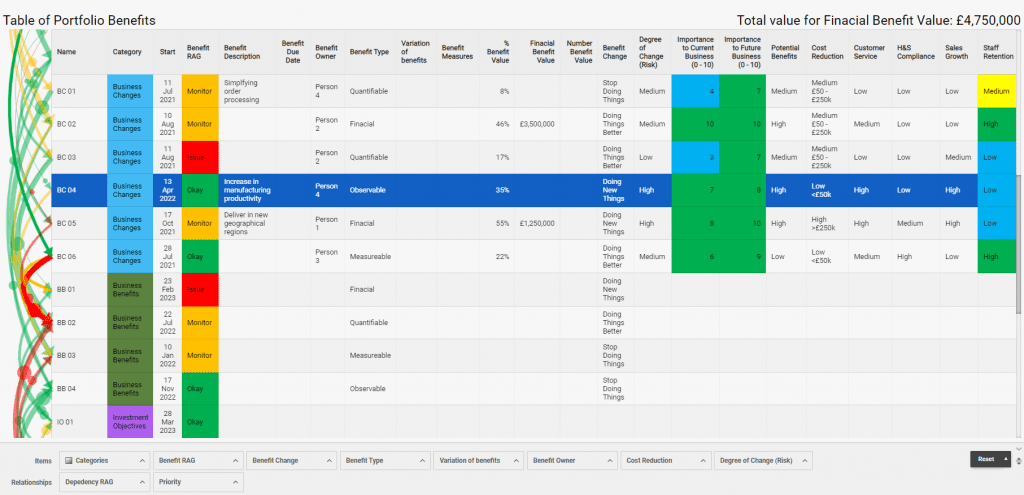
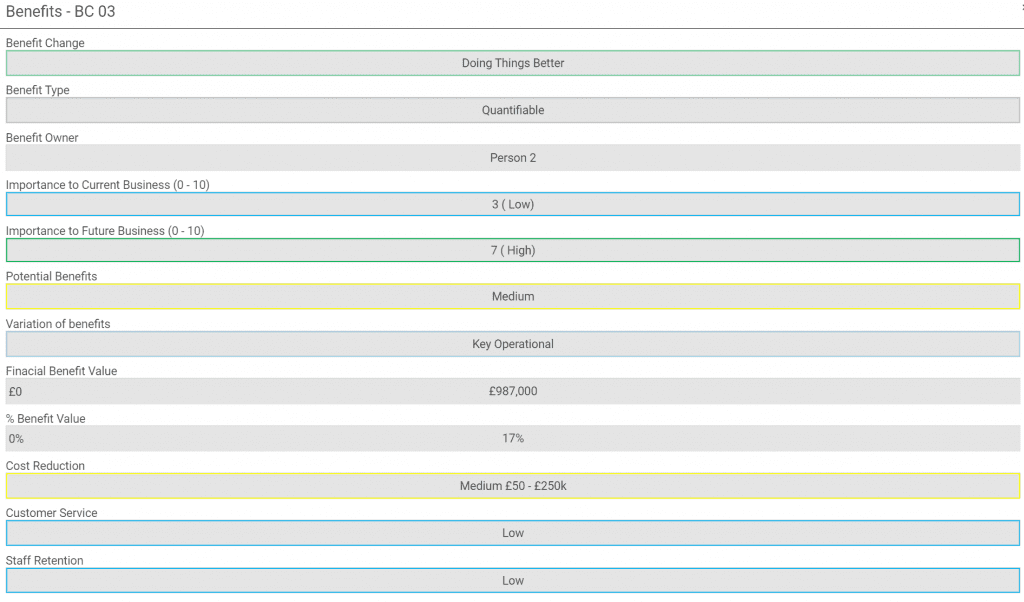
Within each of the Items (square boxes) further information is available to review and generate data driven views such as:
- Benefit Description
- Benefit Owner
- Benefit Change – Doing New Things; Doing Things Better and Stop Doing Things
- Costs
- Resources
- Benefit Measures
- Benefit Type – Observable, Measurable, Quantifiable and Financial
- £ Financial Benefit Value
- % Benefit Value
- # Number Benefit Value
- Degree of Change (Risk)
- Variation of Benefits – Support, Key Operational, High Potential and Strategic
- Areas of Benefit
- Types of Benefits (Low, Medium or High)
- Health and Safety Compliance
- Customer Service
- Potential Benefits
- Sales Growth
- Staff Retention
- etc.
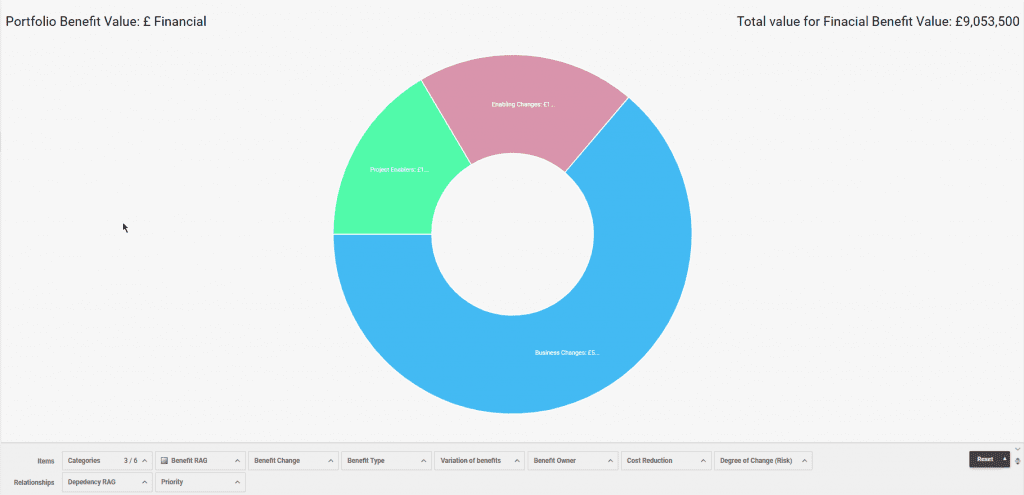
Consistent and accurate benefit data
One of the key benefits in taking this type of approach and using a solution like R-BDN, powered by SharpCloud is that all investments and projects are using the same meta data template. This means you can compare and analyse different aspects of your portfolio e.g. “Costs” versus “£ Financial Benefit Value”, with a high degree of confidence and trust.
In addition, by having a standard meta data template, means your data updates are completed in a controlled and validated way. Which is very beneficial!
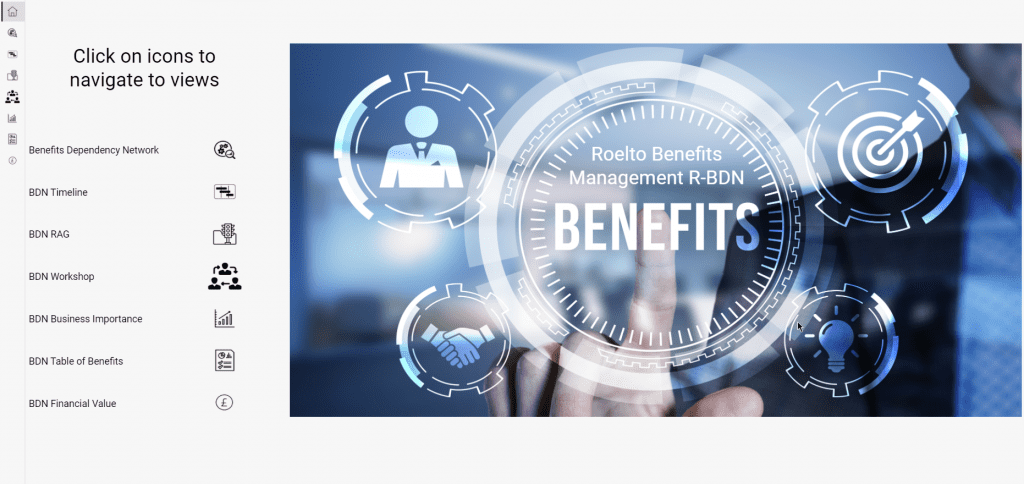
Roelto – Benefit Dependency Network (R-BDN)
Being able to see all of your investment and project benefits aligned to the project enablers, changes and your investment objectives and business drivers provides insight and simplifies complex decision making.

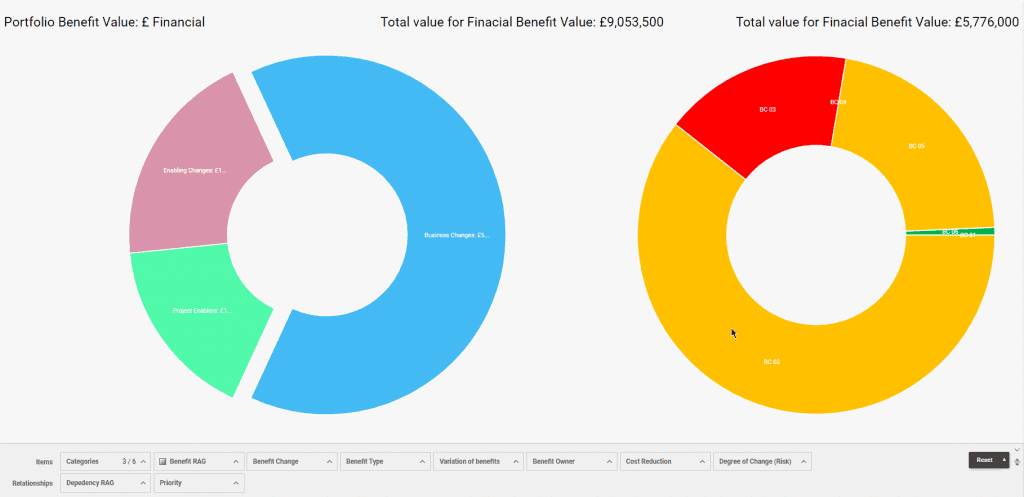
Start Mapping Your Benefits
When it comes to which investments you need to approve and how they compare to your existing project portfolio you will be able to see how they rank against one another, what their priority and status is, among many other data attributes as listed above.
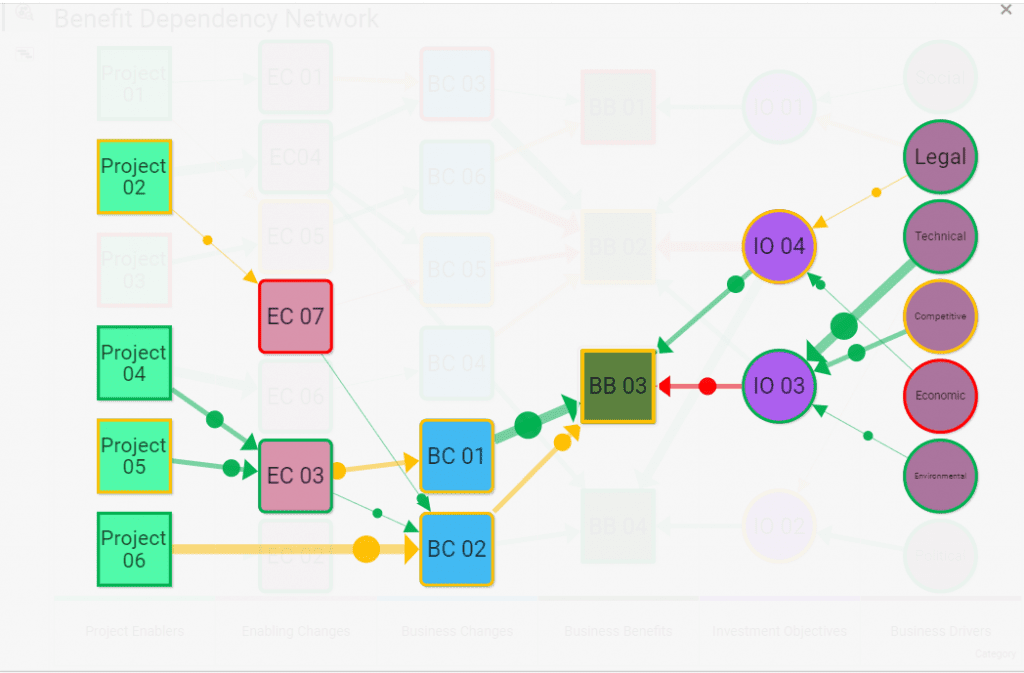
By creating individual Project BDN as shown, these can be linked to other Projects and/or rolled up to your Programme BDN. This can then be linked to your overall portfolio. As each benefit is delivered this acts as an input to another project, programme to proceed so there is a clear “cause and effect” which is linked to one another.
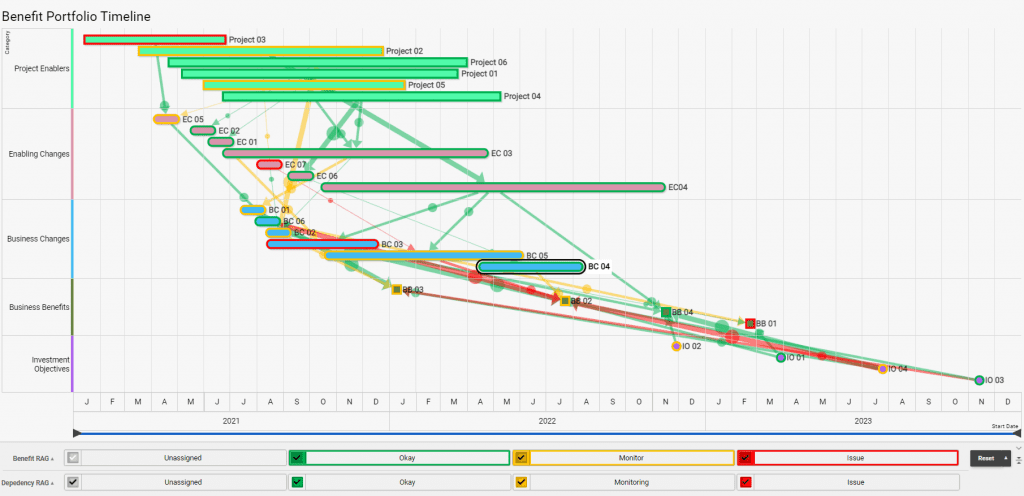
These linked relationships/dependencies shows the “Golden Thread” that can be seen through different data driven views such as a timeline, grid, graphs, compares, etc. giving you the ability to review and mange from different perspectives.
If you are keen to explore more about how you can visually map your business benefits just click the button below to get in touch and have a quick chat.
Further information
I can recommend the following book “Benefits Management: How to Increase Business Value of Your IT Projects” by John Ward and Elizabeth Daniel.