Visualise and Collaborate Your Ideas
If you are new to SharpCloud one of the first decisions you will have to make is how you can best put SharpCloud to work in your business, to help improve your communication, collaboration capability, decision making and overall productivity.
In the Story below, I have shared a selection of stories that I have created since 2008 and hopefully will give you some initial ideas on how you can visualise your business data and facilitate collaboration.
To view this SharpCloud Story fully, please click on the navigation buttons at the bottom. This will open the SharpCloud Story views for you.
Where to start using R-VCS | SharpCloud
A good place to start is to think where your current challenges, problems and issues are.
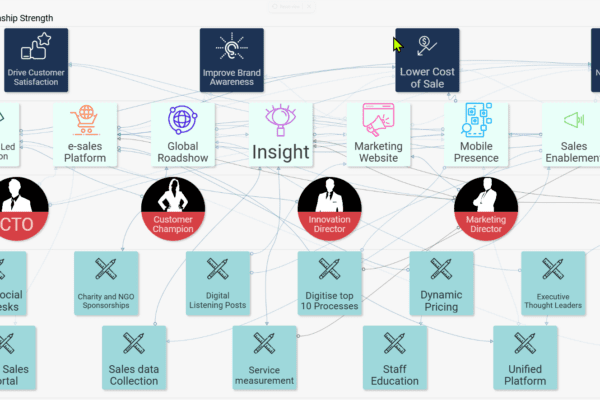
You can use SharpCloud to capture your ideas – do this by “brainstorming” and entering them into SharpCloud Items using the Wall View. You can create some categories and sub categories and move your ideas into these categories using the layer view. You can even start tagging your ideas – such as a persons name or a geographical location for example.
After you have categorised and tagged your ideas, how about prioritising them by using the grid view. Configure some attributes to prioritise your ideas against benefit, ease of delivery, cost and risk by using the list attribute, so you can add simple label’s such as:
- Low
- Medium
- High
Now move your Ideas in to the Low, Medium or High grid for each of your attribute types. Add some relationships between your ideas and a comment if there are any.
Based on the priority you can now create a timeline by switching to the timeline view. Visually drag your idea to the start date you want and drag the end of your idea to set the duration.
In no time at all you have listed your ideas, categorised and tagged them for easier filtering. You have quickly added some attributes to compare your ideas against one another, you can see where there are interdependencies by adding relationships and you have created an action/project plan using the timeline view, all in one place.
How about sharing your story or creating a presentation? Simply publish your story to your private directory or create a link so people can click on it and provide feedback through Like and Dislike voting along with Comments. Even start a video conference call so you can collaborate, co- create additional ideas and refine your existing ones simply, quickly and easily.
Once you have created your Story you can share and view data (Items) from other Stories. For example, the video below shows how this can be done for a project portfolio solution, using the R-PPM app.
Want to discover how to start using SharpCloud | R-VCS?
Just click on the button below “Free 14 Day Trial” and you can start visualising your data, sharing and collaborating it with colleagues and your business partners.
Best regards
Jason
P.S. You will also have a complimentary 1 hour online overview of SharpCloud to get your ideas visualised using SharpCloud. Just leave your details in the form and click the button.