If you are a project or construction manager one of your challenges is how to communicate the status of your project to the project team and your Project Director easily. And if your a Project Director responsible for multiple projects within a programme, sharing and communicating it simply to your Main Executive Board can be an even bigger challenge.
Finally, as a business leader you need to be able to make informed business decisions about your construction portfolio with regards to different sectors, risk and profitability.
Repetitive Construction Reporting
After working 18 years in a global consulting, engineering and construction management organisation the monthly reports became a “block” of paper, spread-sheets and PowerPoint’s all combined into a monthly PDF report that I know were not always read, let alone acted upon. Not because the data wasn’t any good. There was just too much for the relevant people to review and to be able to make a timely informed business and project decision.
Reporting and communicating has always been an issue for many businesses and I’m sure this applies to you in some way. Construction projects as you know are highly dynamic in terms of the building being designed and constructed, the increasing complexity and changing workforce as the project moves from concept into design, procurement, construction, commissioning and final handover to the end user.
Typically manual, repetitive reporting involves copying and pasting data from one spreadsheet or presentation to another. This continual, non added value process just wastes time and money and as discussed earlier, does not away get used or provide the answers to make an informed decision.
Understand Your Organisational and Communication Network
Getting the information from the “coal face” where the action is taking place is vital. In some cases this easier than others. Information from office based workers will be easier to get compared to the project team working out on the site and in a different location. One of the key observations that I always saw when reviewing projects around the world, was the difference between the organisation structure posted up in the project office compared to the organisational network and communication that actually happens out on the site There are two forms of communication in action:
- Structured and organised – this is typically with the client, prime contractor and other “significant” disciplines (Tier 1’s), with agreed meeting schedules, agendas and reporting formats
- Unstructured and ad hoc – this is where people working out on the site have conversations, they agree amongst themselves how they will move forward and resolve issues (tier 2 and 3)
Understanding your organisational and communication network at a project, programme and portfolio level across your business is vital because they are different. Being able to tap into these business social communication networks and relationships easily will help to capture the nuggets of information you need to make the right business decisions.

Improved Business Decision Making Using Visual and Collaborative Reporting
The real challenge is how can you tap into these conversations and decisions that are being made by the various trades, contractors and other project team members who are either working out on the site or in a different location. Ultimately these decisions will all have some sort of negative or positive impact on schedule, risk, cost and safety. You and all the other project members will have existing communication and reporting systems and processes in place and trying to collate this information into a meaningful report is part of the communication issue for you.
Getting information from a planning and cost control systems for example is getting easier to do. Agreed there will need to be some technology interface (API) so systems can talk to one another but it is easier to implement. Capturing the “conversations” that happens outside the “systems” is more challenging, which is why you need a way to combine both without making any changes to your existing processes and systems and utilise technology that nearly everyone has at all levels within the project, such as smart phones.
You need to take a visual and collaborative reporting approach to help improve your business decision making.
SharpCloud – a visual communication tool
The workforce on your projects will have multiple languages and cultures. Being able to visualise information so people can see, understand and take action is vital. Typically there never seems to be enough time to provide “training” on new systems, so what ever communication and reporting system you have it has to be easy to use and free for people to use. It needs to be able to take and visualise both:
- actual data and information either manually or automatically from systems ( such as cost (EcoSyst), planning (Safran) and others.)
- social information and knowledge from peoples conversations
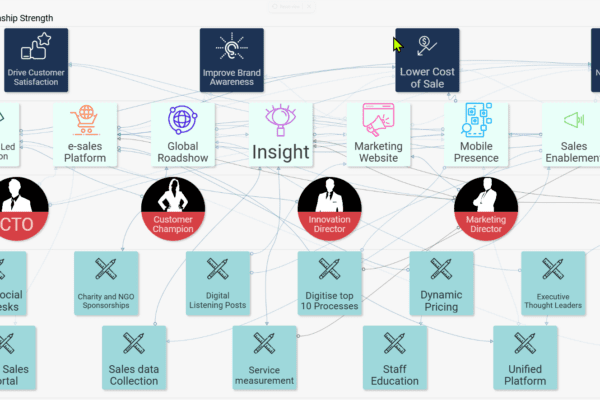
SharpCloud is a visual communication tool that combines both data, information and knowledge all into one visible place quickly and easily. By combining financial, planning, safety data and information such as scopes of work, with comments from people who are working on a particular part of the project provides visibility and transparency of what is happening across the project. This is turn improves the overall collaboration and productivity of the project team and your business.
SharpCloud works across multiple platforms so people in the office can use their PC and laptops, while people out on site can use their mobile devices (smart phones) to add comments and status so there is a real time business social update being provided near to real time and you as a business leader, can access it via your tablet to review and support your Project Teams as necessary.
Generating reports is automatic
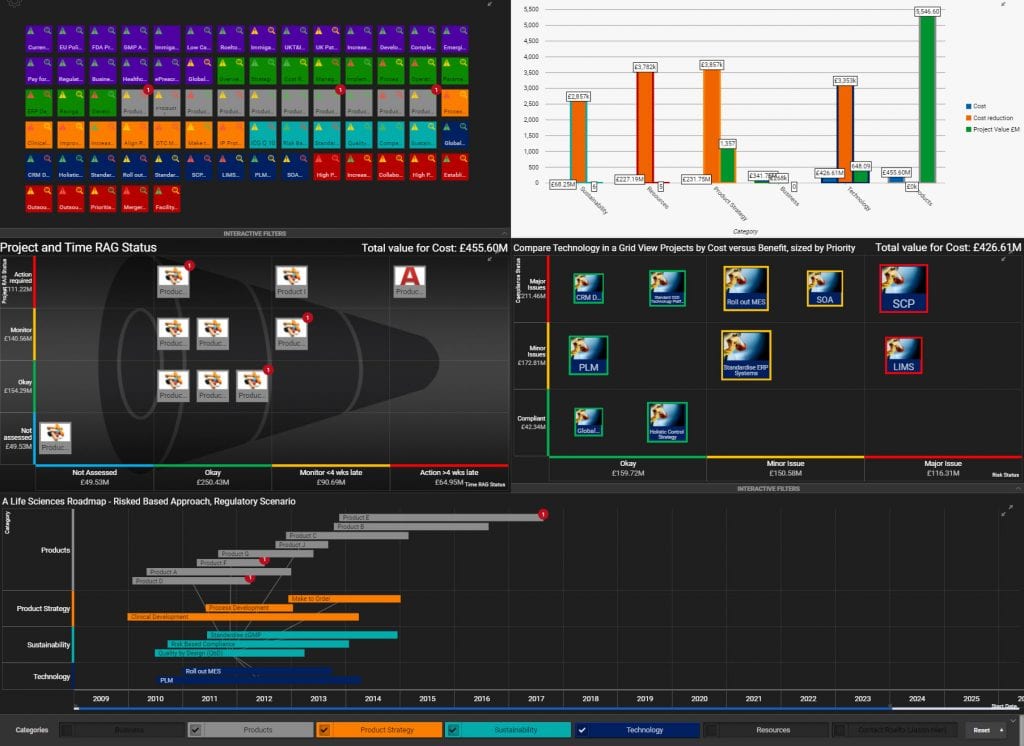
SharpCloud enables you to create data driven views so you can create different reports in the form of presentations that suit your audience. As the data changes and is updated so are your presentation reports. No more copying data and re-editing PowerPoint slides, converting into PDF’s and emailing to people who may not even read them! You can look at your Project “Story” at any time, you can see if there is a problem, are people talking and discussing about it so you know action is being taken.
Visualising your projects, programmes and portfolio enables you and your project teams to communicate, collaborate and report more efficiently and effectively saving you time and money, so you can all focus on delivering a successful, safe and sustainable outcome.
Free 14 Day SharpCloud Trial
To discover how you can start putting SharpCloud to work in your Construction Projects to help improve your reporting and decision making, just click the orange button below, your details in the form to claim your Free 14 Day SharpCloud Trial.
Plus you will get a complimentary starter workshop facilitated by a SharpCloud Expert with Construction experience.