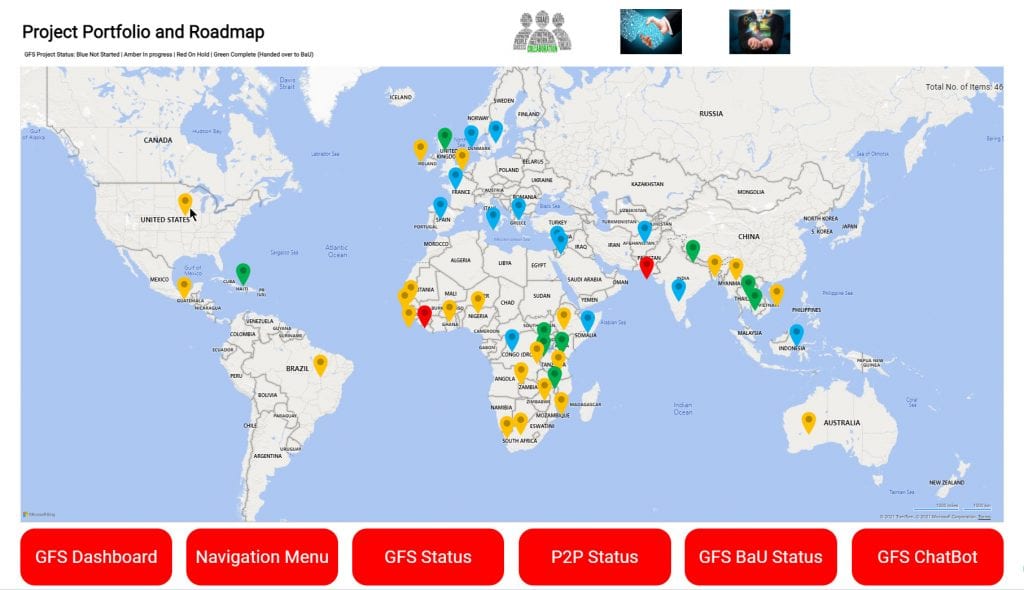
Uncover insights and make informed business decisions with R-DBR

(Roelto – Dashboard Reporting)

Visualise your data collaborations quickly and easily

R-DBR provides you a simple and easy way to see your data immediately which you can share and socialise to gain feedback and insights.  Enable your functional and project teams to update their data and put it into context so everyone is on the same page.

it gloabl roadmap

Reduce non added value administration time & costs

If you have to collate reports and information from various groups, teams or functions and consolidate this information into a standard report, R-DBR can help you reduce the non-added value administration time by providing the “data providers” with an online form to complete, which when submitted updates the dashboard instantly.

No more updating presentations or reports and emailing them.  All your dashboard views and presentations are updated, ensuring everyone has the most current data to help make the right decisions.

Example of R-DBR

Feel free to interact with one of our R-DBR apps, ISO Collaboration Dashboard.  Just point and click to navigate, filter and discover more.

R-DBR  Overview and Functionality

Your dashboard can be a simple status or a combination of views.  Using annotations and built in widgets you can create views and dashboards that are aligned to your audience.

R-DBR is online service, powered by SharpCloud enabling you to get going within minutes so you can share and collaborate.

Click the R-DBR icon to learn more.

R-SRM: Overview and Functionality

Overview

If you have to collate reports and information from various groups, teams or functions and consolidate this information into a standard report, R-DBR can help you reduce the non-added value administration time by providing the “data providers” with an online form to complete, which when submitted updates the dashboard.  The submitted data is also used to perform calculations and is presented in the various dashboards.  Dashboard views include some standard views and can be easily configured, added to or new ones created as appropriate.  This can be a simple standalone solution or include data and view templates for enterprise dashboards used by multiple teams.

Below is an example of a dashboard for a global IT project being deployed to over 46 countries which simply shows the project status of all projects and acts as a visual dynamic communication tool to all stakeholders.  The user can click on each country, and several panels of information will be displayed (see Figure 5).

R-DBR project status panels
project status panels

it gloabl roadmap
R-DBR: IT global roadmap dashboard

Click the icon

R-DBR reviews

“I would highly recommended Jason to any business wanting a professional and creative Sharpcloud business solution integrator.”

Daniel Eastwood
Head of Performance and Transformation, Babcock International

Try R-DBR for free