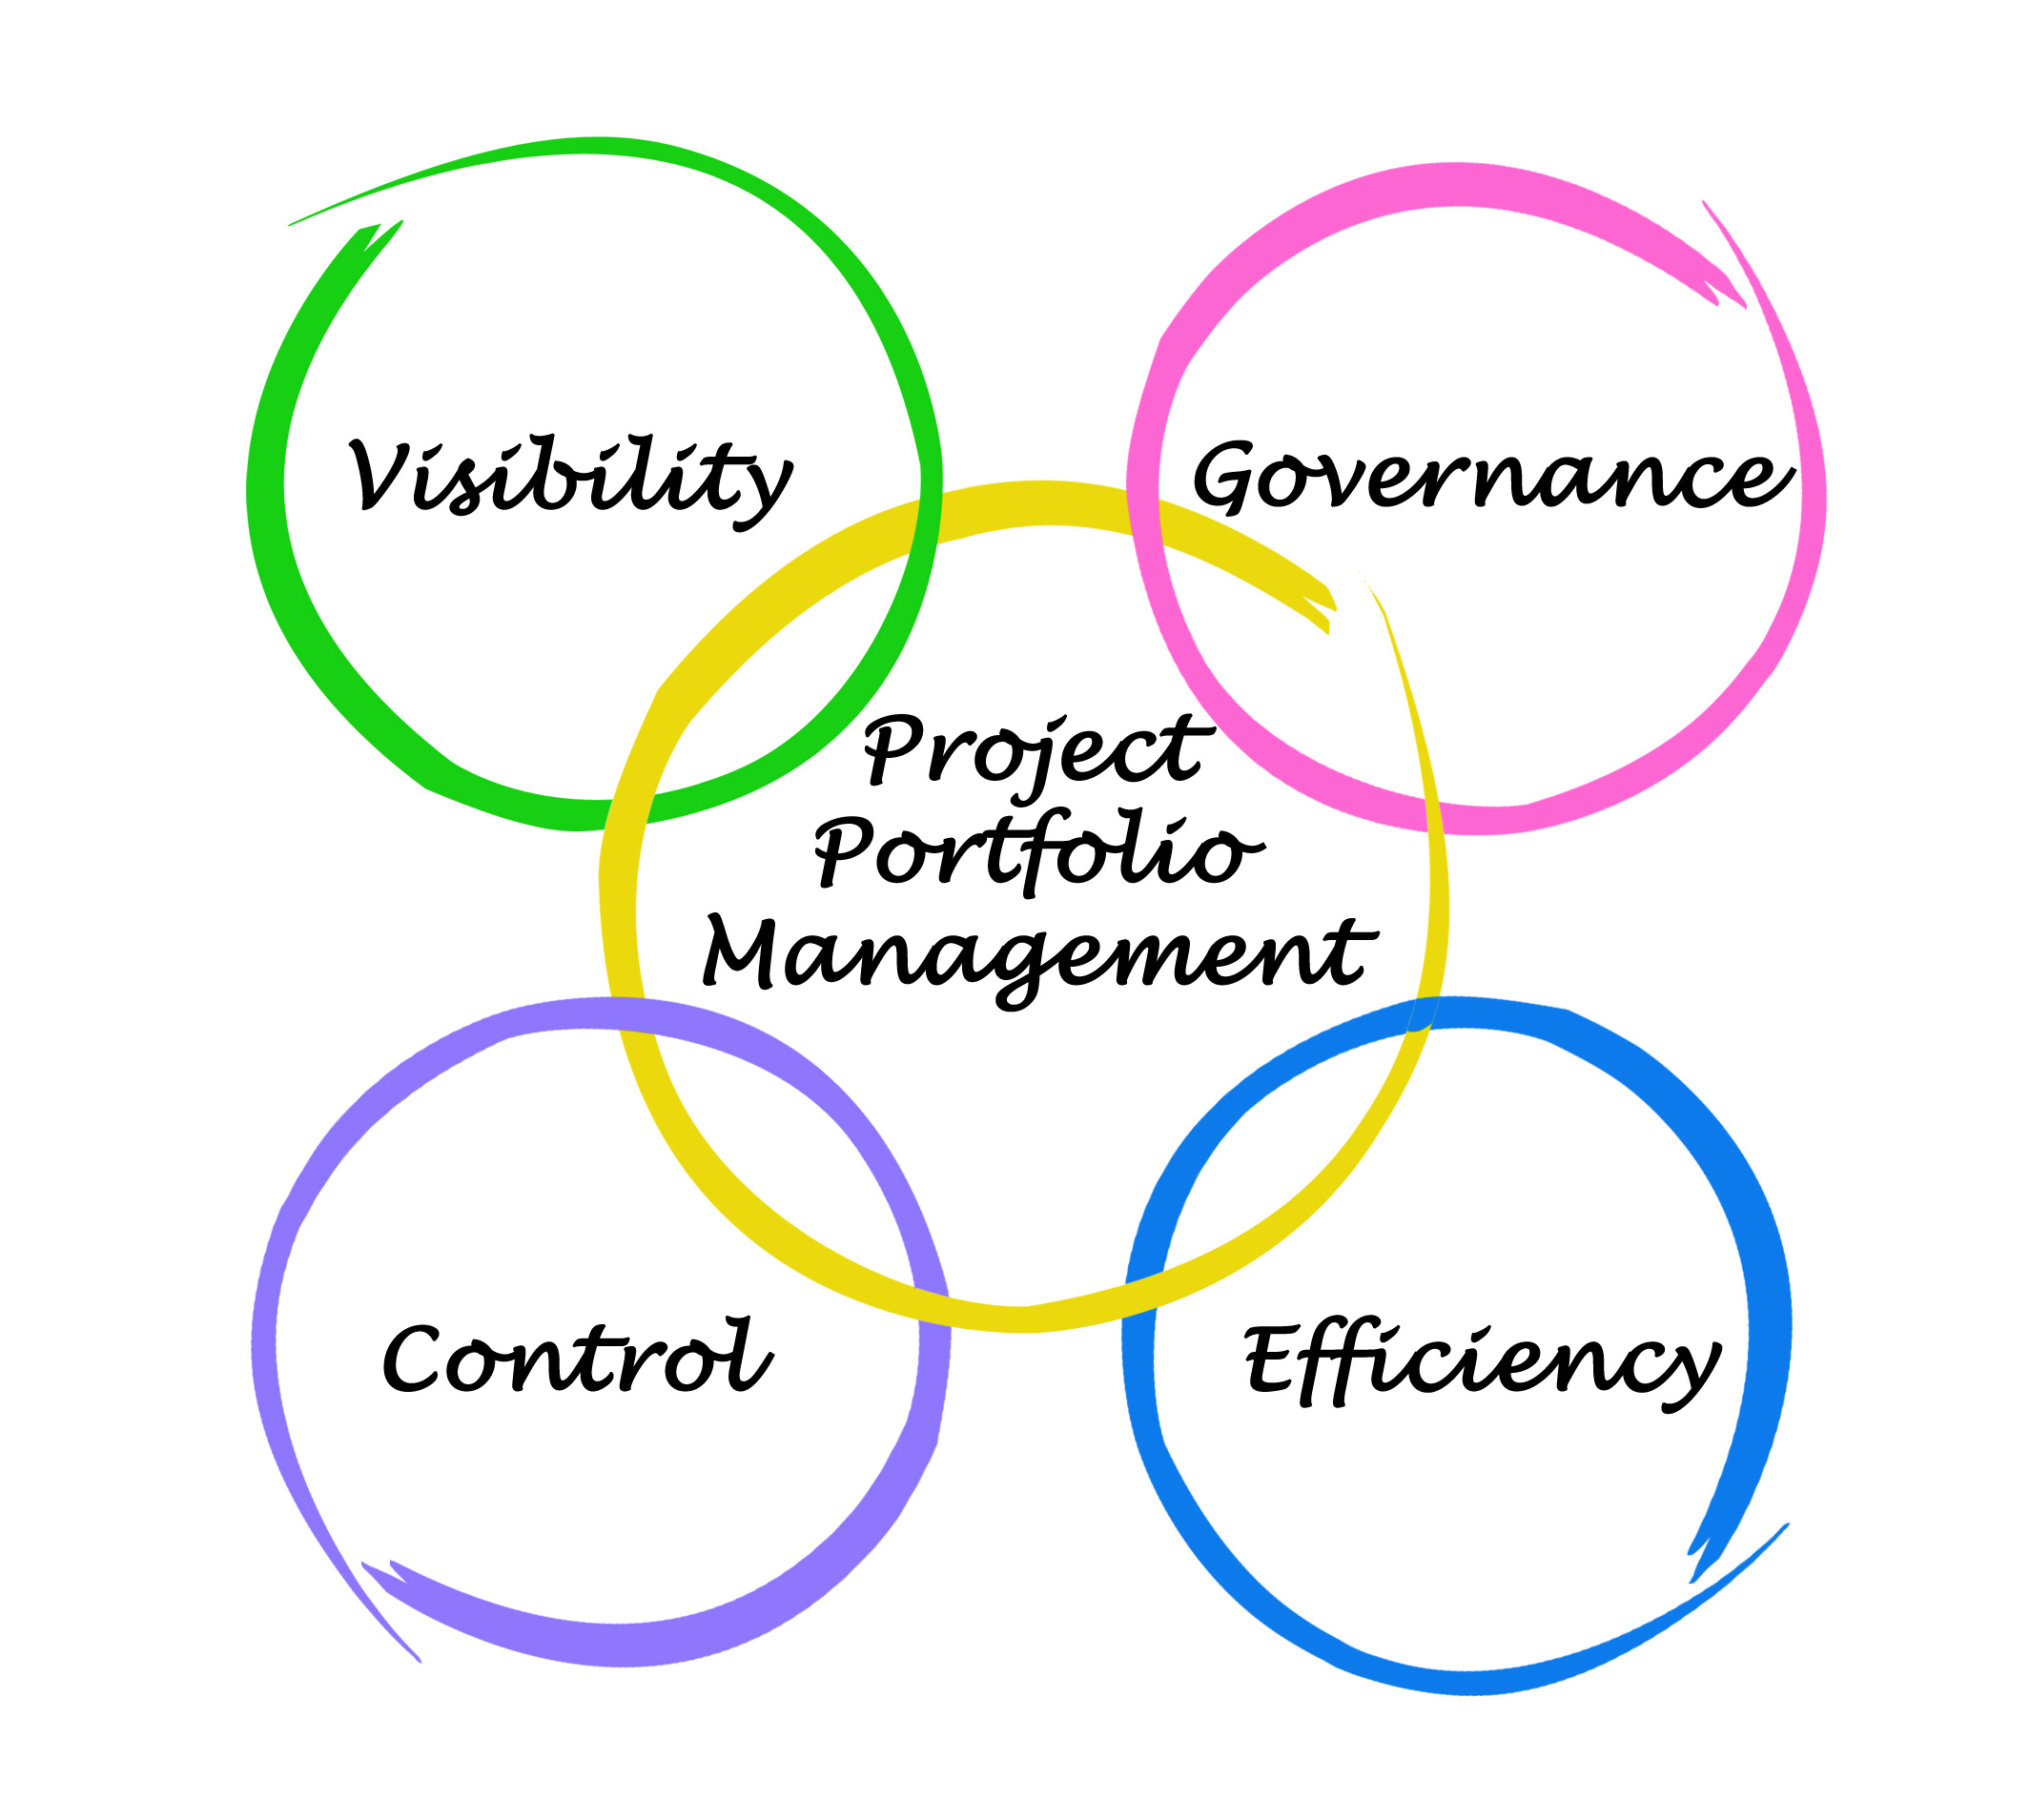
Project Portfolio Management Workshop Overview
A common challenge to managing a portfolio of projects effectively, is getting all your relevant and key project data and project commentary into one place, so that you can see it altogether.
Typically there are specific project Line of Business Systems (LoBS’s) which create separate “data silos”, such as:
- Project Management e.g. MS Project, Primevera
- Risk Management
- Cost and Commercial Management
- Benefit Management
- Change Control
- Documentation Management
This is further complicated when you have poor data governance, quality and standardisation. This leads to incorrect project information and a lack of data trust.
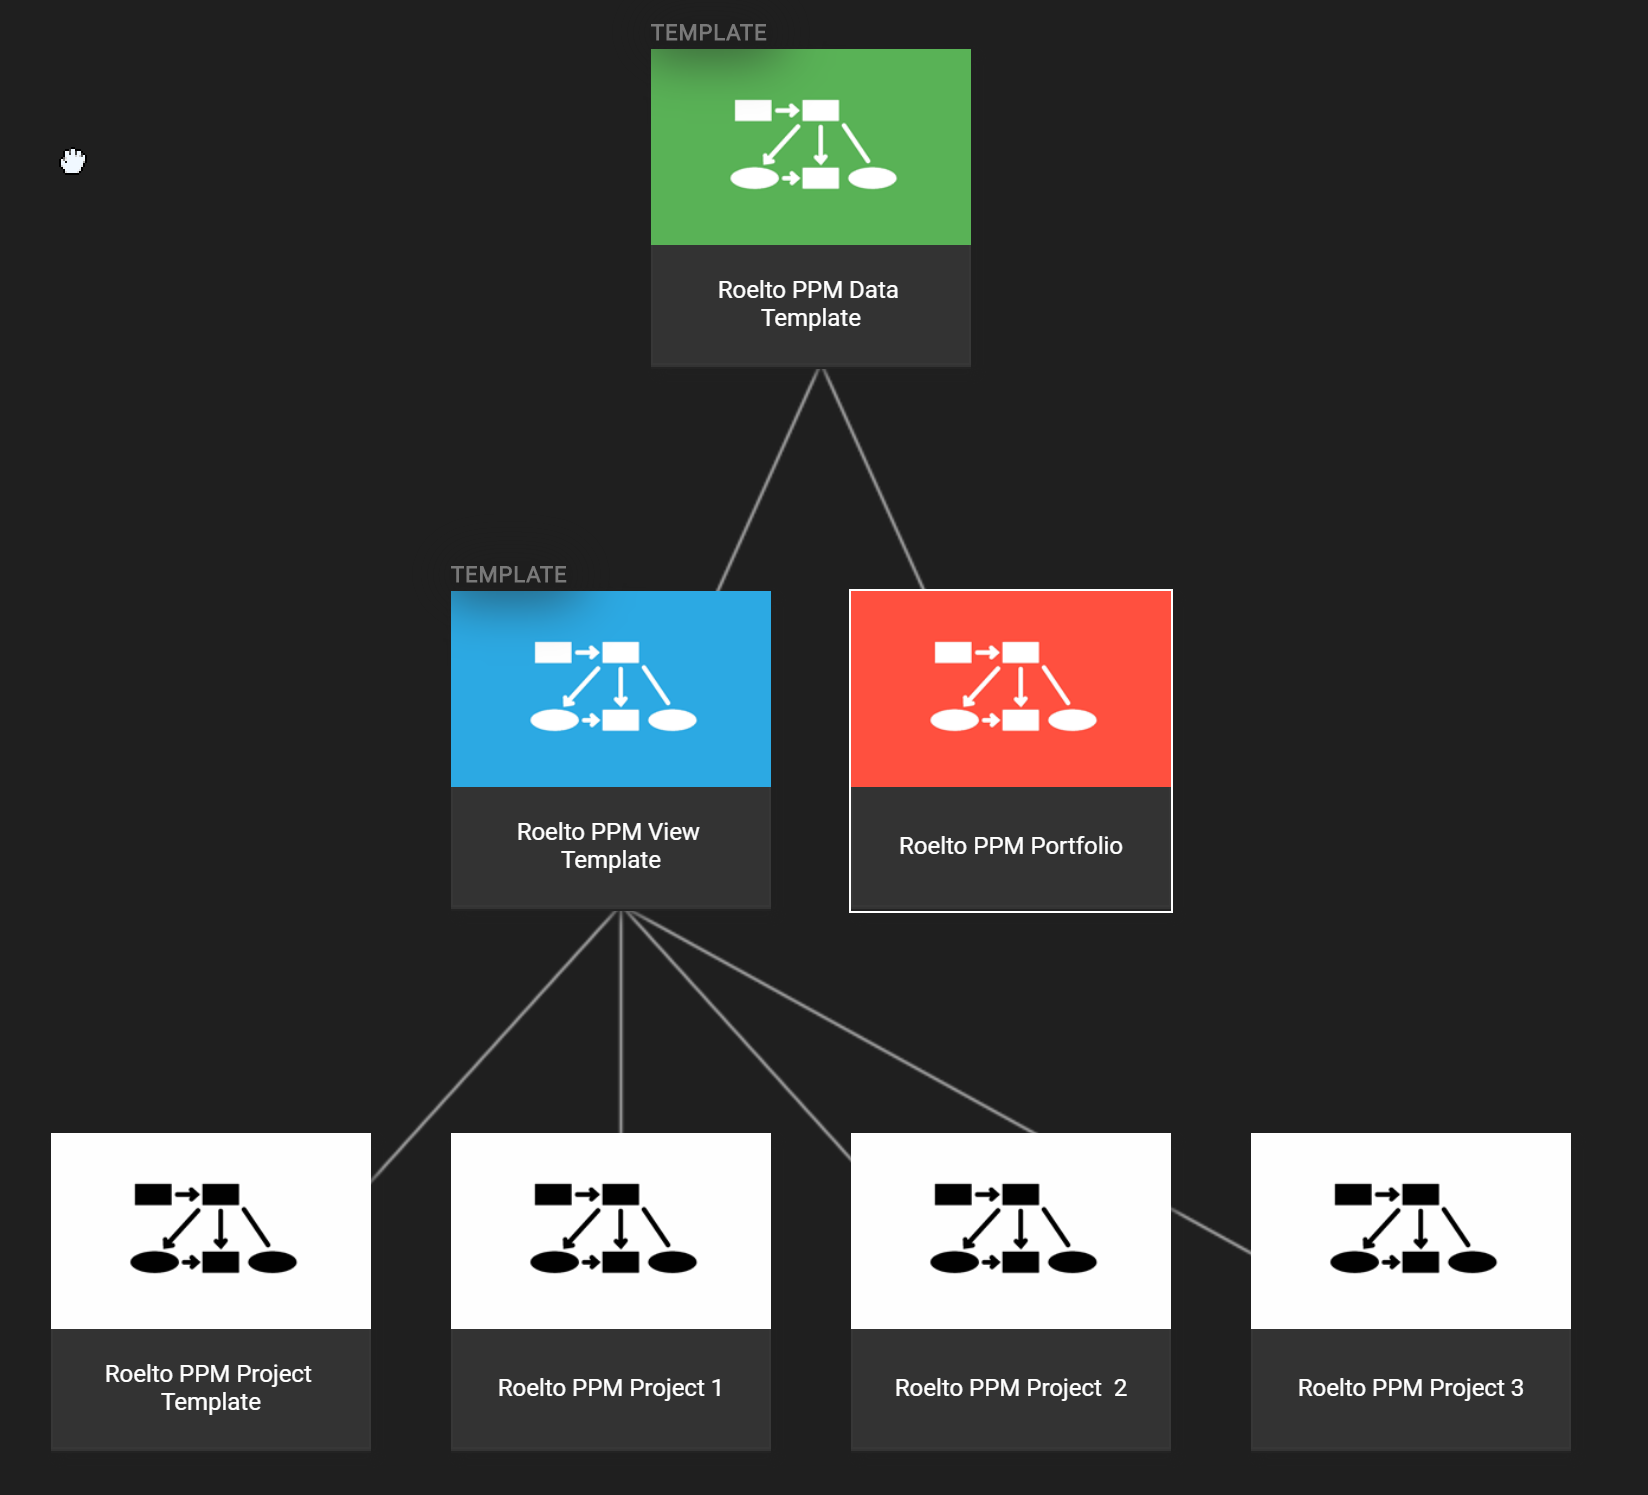
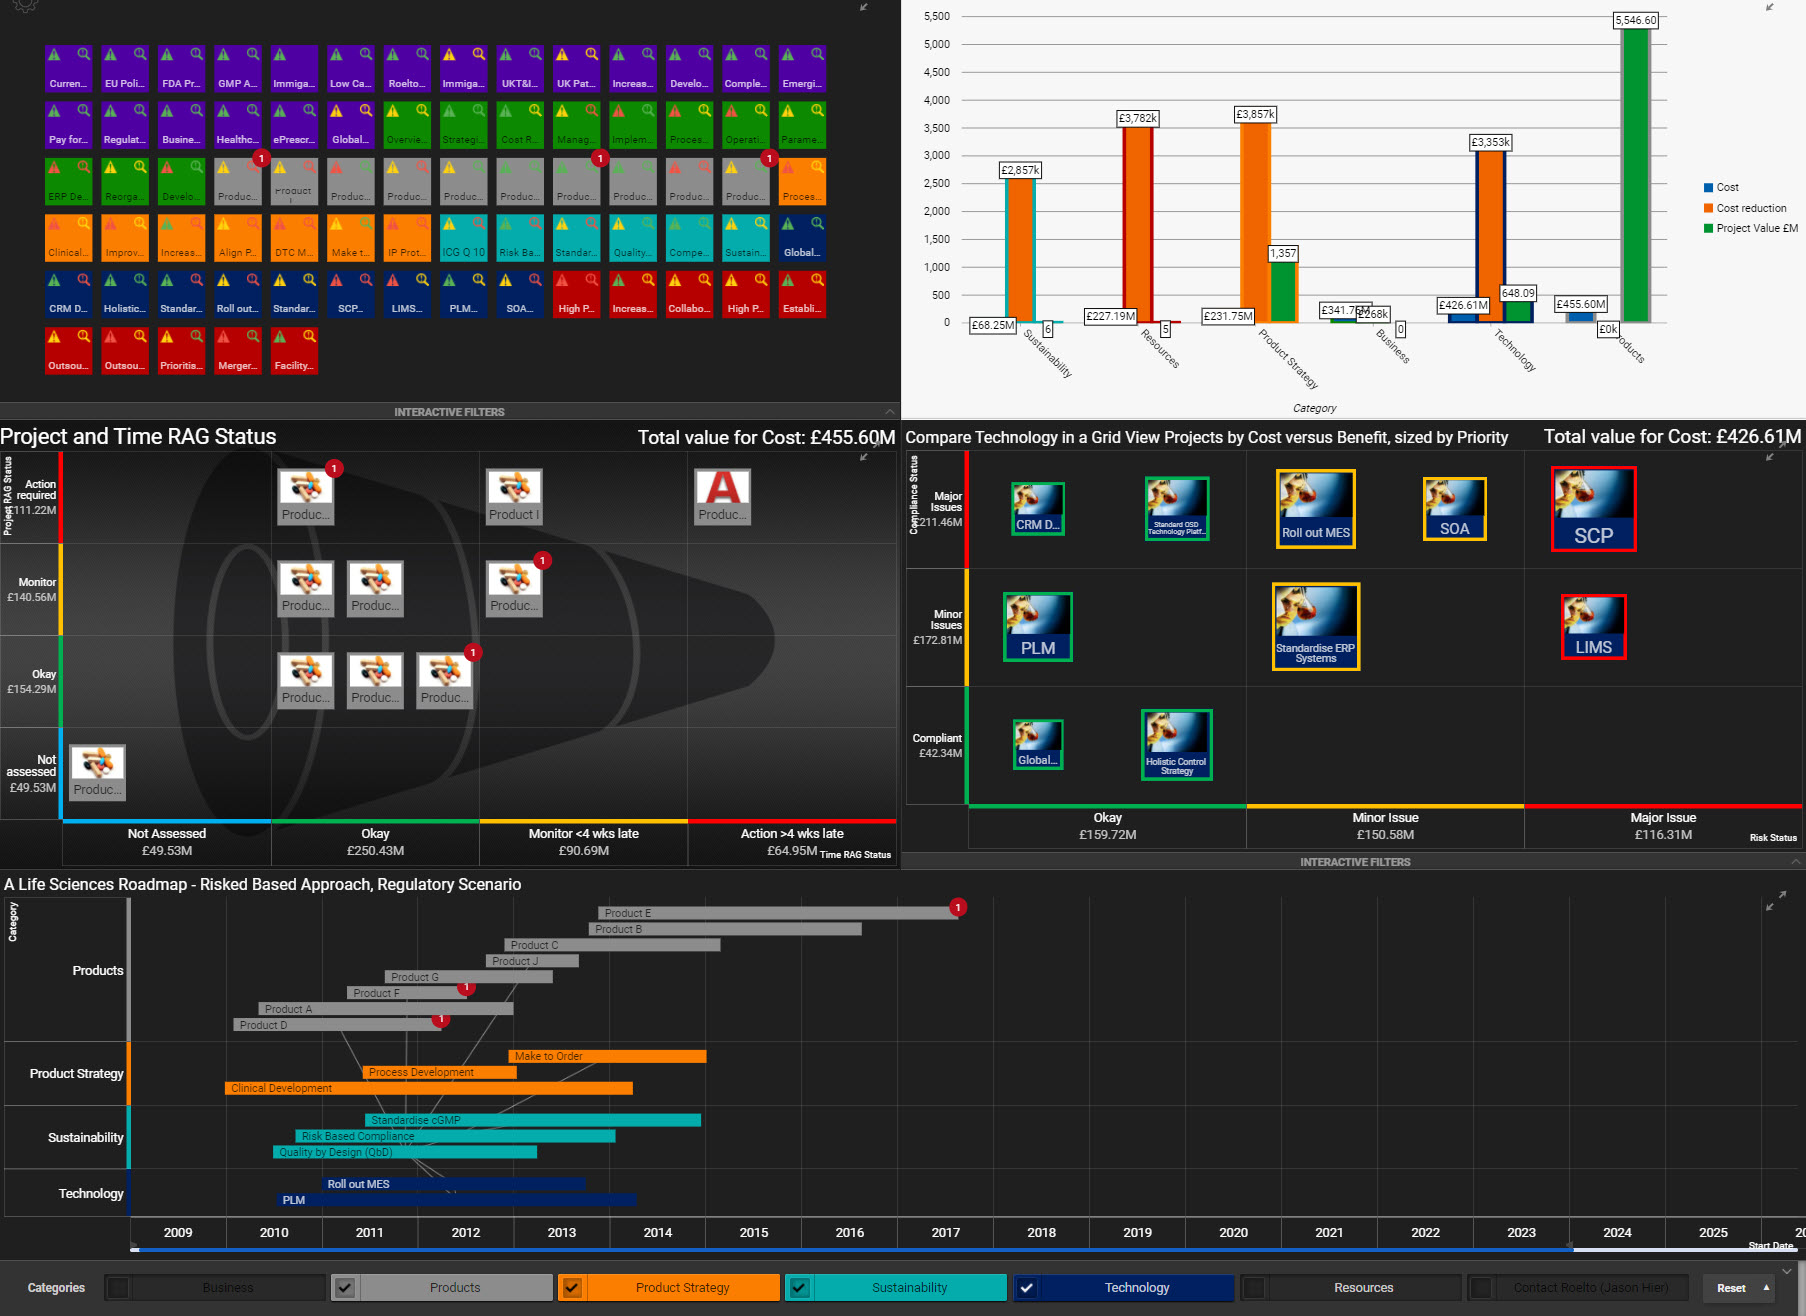
Completing a Project portfolio Management Workshop using R-PPM you can co-create visual dashboards and data driven views as a way to see your project data in various views that is easy for people to understand, communicate and facilitate successful project delivery. Using R-PPM and our ready built templates you can create your visual and collaborative project portfolio management views that will help you to uncover insights and simplify complex decision making:
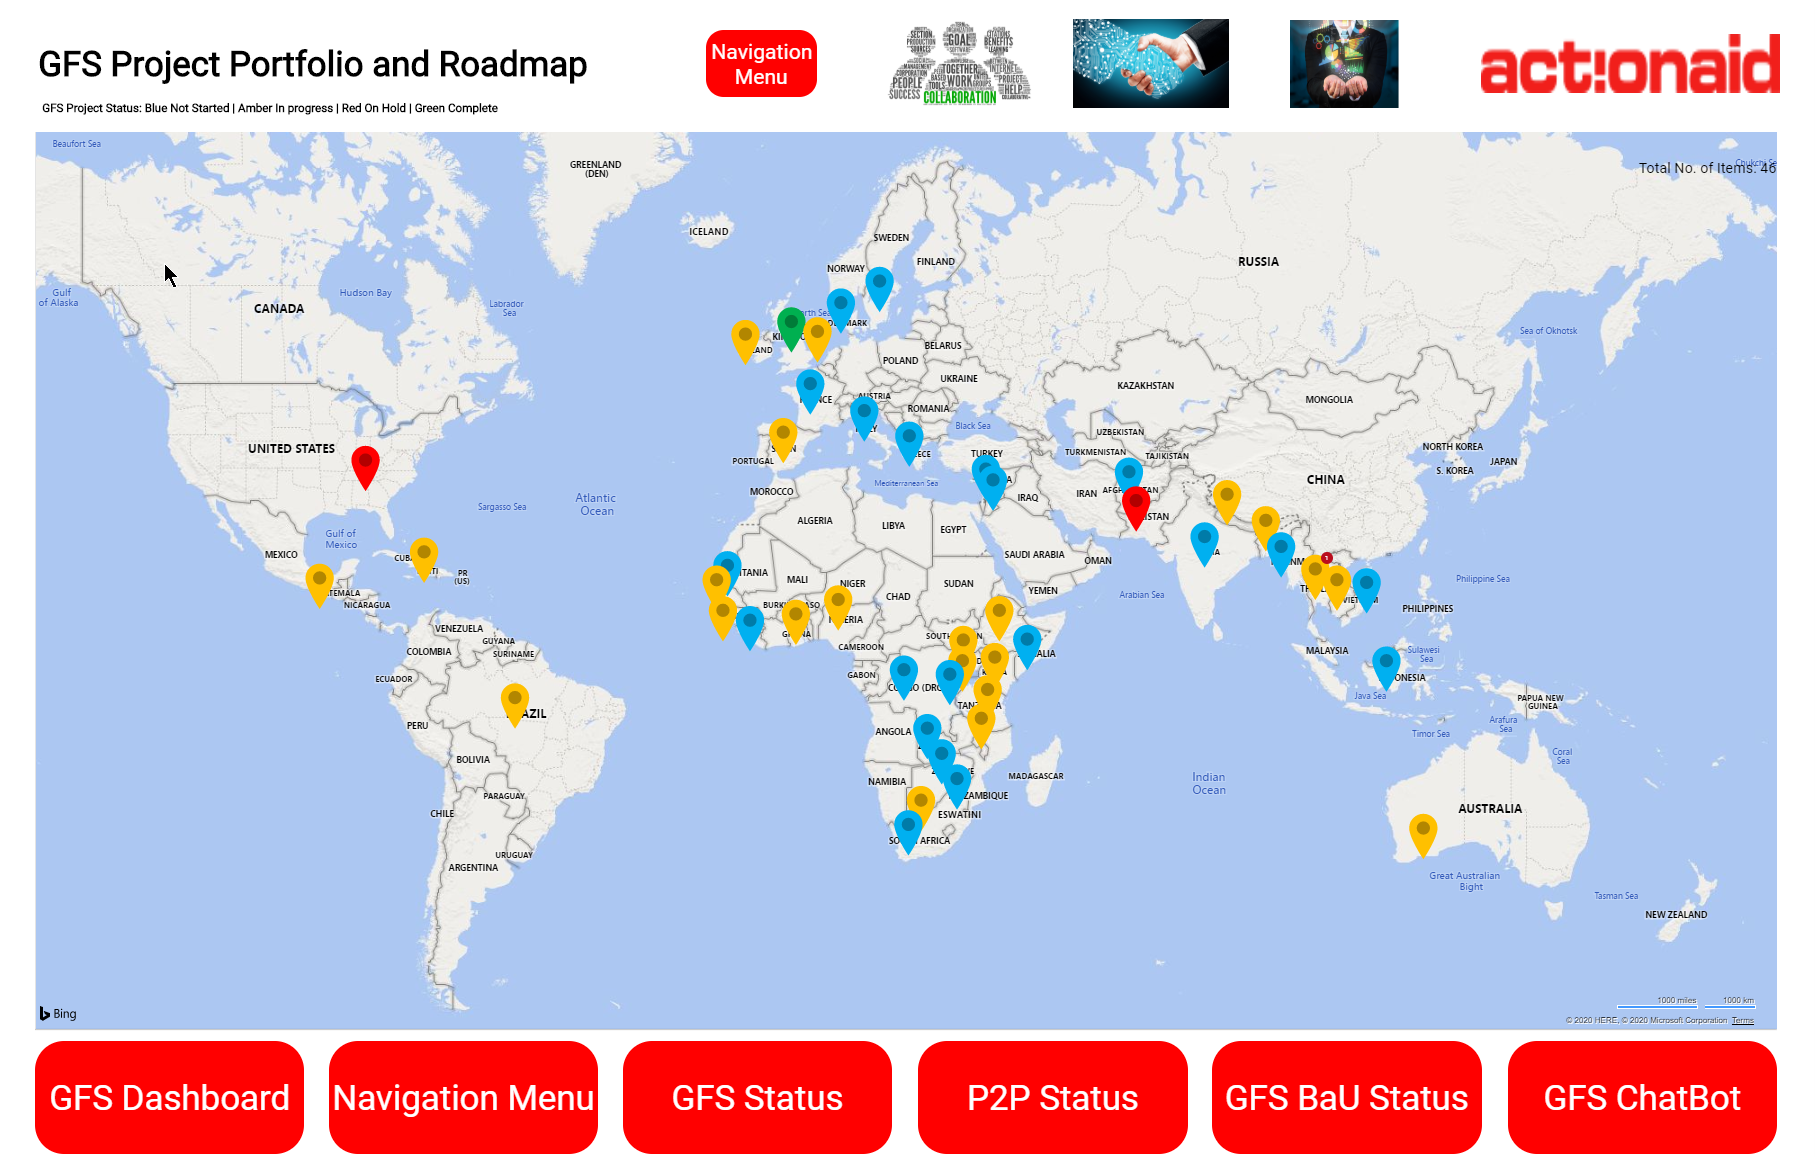
- RAG Dashboard – provides navigation as well as a focus area of your projects/portfolio so you can immediately deal with the important aspects.
- Project and Programme Health – review the status of all your projects and make an informed decision at a Programme level for key aspects such as:
- Overall status
- Schedule
- Resource
- Costs
- Risks/Issues/Opportunities
- Benefits
- Programme Dependencies (internal and external)
- Project Health – A more detailed view of all your projects in a matrix, such as overall RAG status against your project lifecycle stage with multiple filters e.g. Location, Project Theme, etc.
- Lifecycle – Understand where your projects are in your lifecycle stage and their status, including a separate view of your ideas/innovation projects
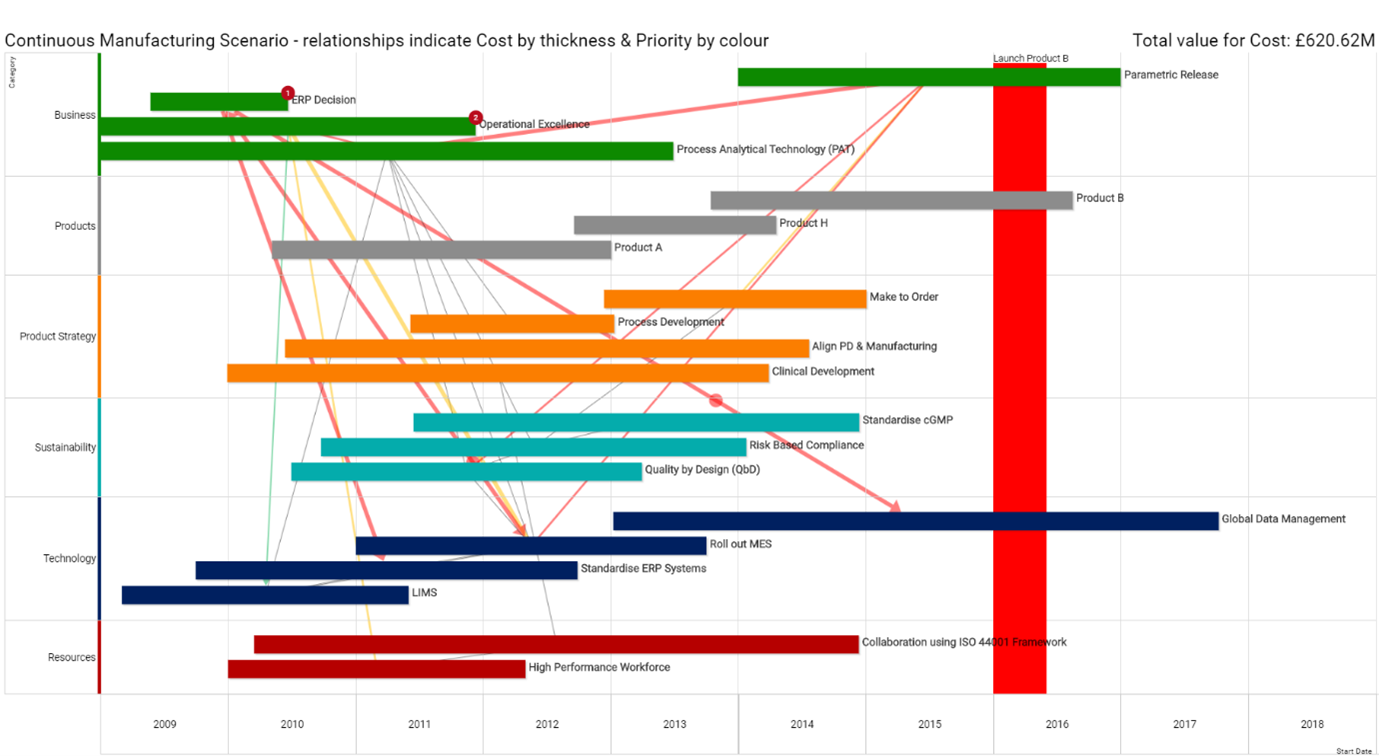
- Schedule – See if project are running late, early or on time. Breakout of phases, milestones and their status including any variances in days.
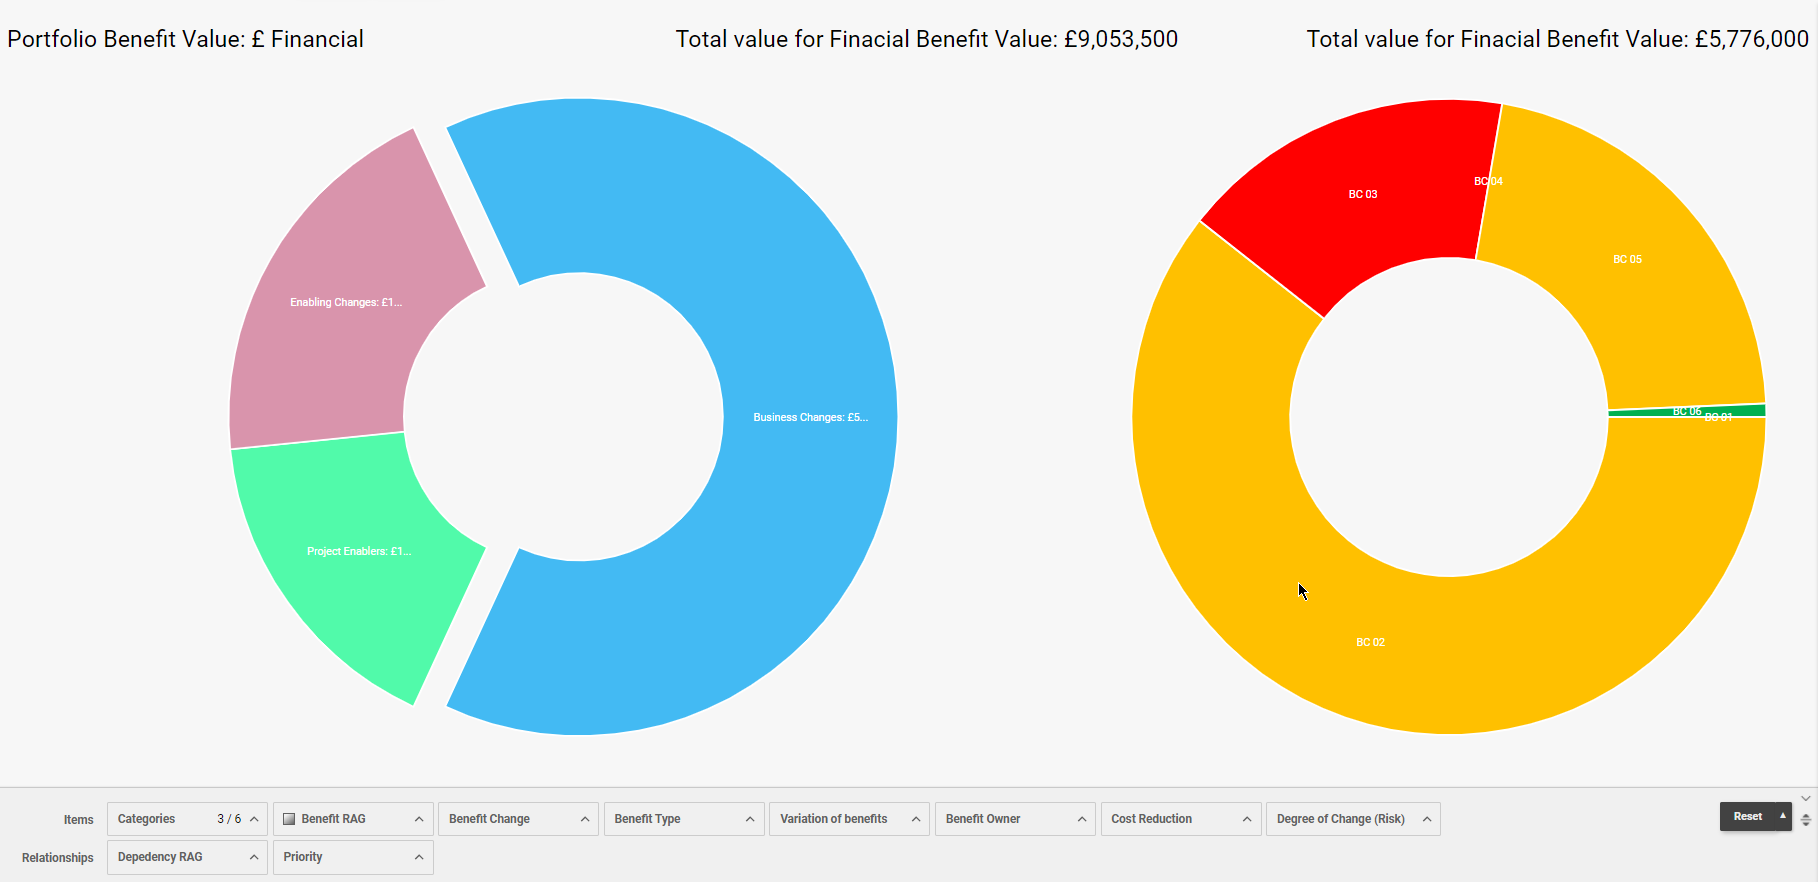
- Costs and Benefits – Either show costs as a graph or combine with an existing view. eg Overall RAG status and Lifecycle – you will see the overall costs plus the costs for each part of the matrix. You can also link to your cost management system or existing reports such as Microsoft Power BI via a HTML panel.
- Performance Benefits – list your projects by Performance RAG and include other performance data attributes such as comments, Strategic Benefit(s), Theme, and various KPI’s.
- Golden Threads – link your projects to your project metrics, KPIs and Strategic Benefits to your overall business strategy objectives/outcomes to show the cause and effect at a project, programme, portfolio and business strategy level.
- Risks – Show your project risks in a Probability Impact Diagram (PID) based on the average risk values for each project risk. Set your Programme and Portfolio Risks based on this data driven view.
- Resources and RACI – Assign resources to your projects, visualise your resource loading and understand who is responsible, accountable, needs to be consulted or informed for all your projects.
- Project Updates – quickly understand the level of accuracy of your projects based on the last time they were updated.
Using R-PPM, powered by SharpCloud you can quickly create your project programme and portfolio with other colleagues, no matter where they are. Using any one of our R-PPM templates will help you to create the right Project Portfolio Management solution all of which can feed into your over business strategy roadmap. By visually collaborating together you can plan, prioritise and implement various projects to successfully support your innovation, business operations and strategy.
Key Benefits
- Breakdown “Data Silos” show your critical project data from other Line of Business Systems and spreadsheets all in one place
- Communication tool – help people to understand your project/portfolio status to facilitate project execution and successful delivery.
- Project and business alignment – ensure all your projects are aligned to your portfolio objectives, benefits and business strategy objectives and outcomes.
- Flexible format – templates and views can be readily configured to address particular project needs and complexities
- Reduced project data risk – standard project meta data template ensures all projects are using the same, quality data removing data uncertainty and increasing data trust so you can make informed decisions
- Start Immediately – based on proven templates and views, this workshop method enables you to start using R-PPM within a day or two.
- Reuse existing project data/reports – connect other project systems to get data automatically and link to existing project reports and dashboards and integrate seamlessly in to R-PPM.
